In brief
- Tracking key accounts payable (AP) metrics is essential for optimizing AP performance and improving the bottom line.
- Four core accounts payable KPIs are crucial for identifying bottlenecks and opportunities for improvement.
- AP automation is widening the gap between top and bottom performers, but measuring its effectiveness is crucial for understanding its full impact on your organization.
Monitoring accounts payable performance metrics can have a direct impact on your business’ bottom line. But measuring the success of your AP process requires more than tracking how many invoices are past due.
Traditional AP departments are often wrought with inefficiencies, overworked and crunched for time beneath a growing mountain of invoices, high staff turnover, and manual accounts payable processes that place heavy reliance on paper and spreadsheets.
Top-performing AP teams process more than three times the number of invoices than bottom performers, according to American Productivity & Quality Center (APQC) benchmarking data. The cost per invoice processed is also almost four times higher in a bottom-performing organization.
Using accounts payable benchmarks to uncover bottlenecks and shape a strategic approach to improving your AP process builds a bounty of benefits: increasing agility, cutting costs, mitigating risk, improving cash flow, driving additional revenue, strengthening vendor relationships, and aligning the accounting department with your organization’s overarching goals.
Let’s examine the key performance indicators (KPIs) every AP department should be tracking to ensure you are asking the right questions and gauging the impact of improvements.
4 accounts payable performance metrics every organization should track
Benchmarking works most effectively when you consider multiple lenses: measuring your department’s performance internally, relative to organizations within your industry, and against cross-industry data.
Ultimately, the accounts payable metrics you choose should reflect what matters most for your business. But four AP KPIs stand out as essential to improving effectiveness and efficiency:
1. Cost effectiveness
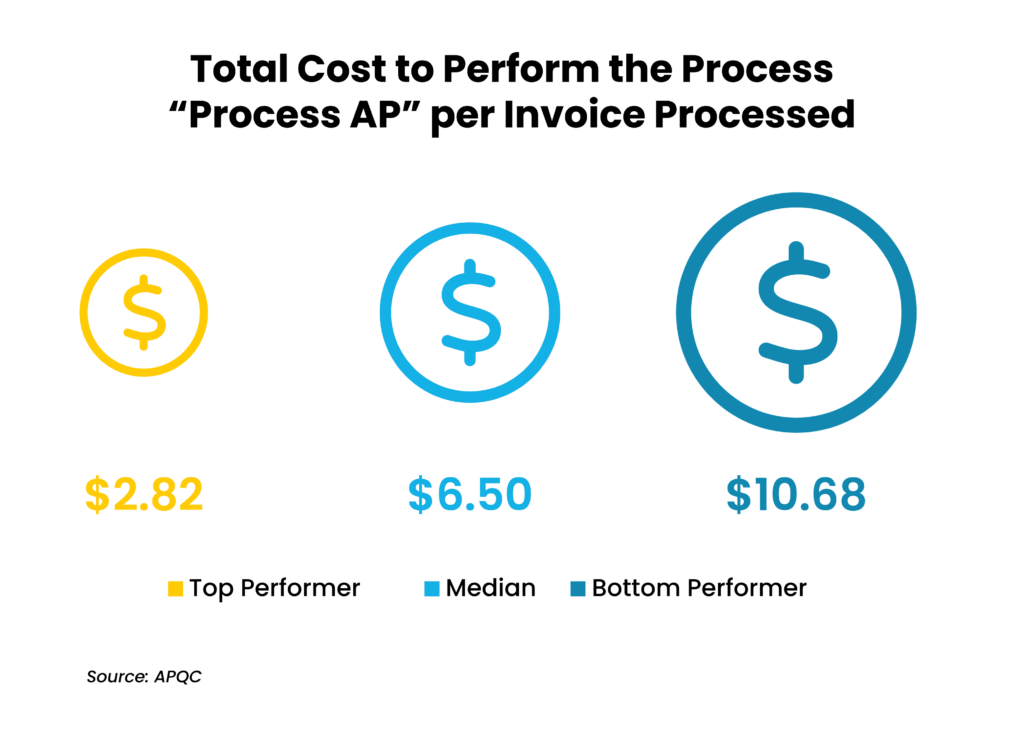
Measuring cost effectiveness is critical to understanding how well your AP operating costs are managed. Calculating cost per invoice, or unit, is an effective method of assessing your organization’s cost effectiveness.
Calculating cost per invoice: Determine your total cost for performing the accounts payable process and divide it by the number of invoices processed to reveal your cost per invoice, or unit. Total cost includes the sum of labor, outsourcing, overhead, and other AP process costs.

The lower the number, the better your AP performance. A high dollar ratio suggests opportunities to reduce costs with productivity enhancements like automation and electronic payment procedures.
Top performers complete the AP process at $2.82 cost per unit – nearly four times less than bottom performers and more than double the cost of median performers.
But keep this in mind: costs per unit can appear deceptively low if you fail to consider hidden expenses that impact your profit margins. That may include the cost of systems, mailing, printing, overpayments, late payments, and other errors.
2. Staff productivity
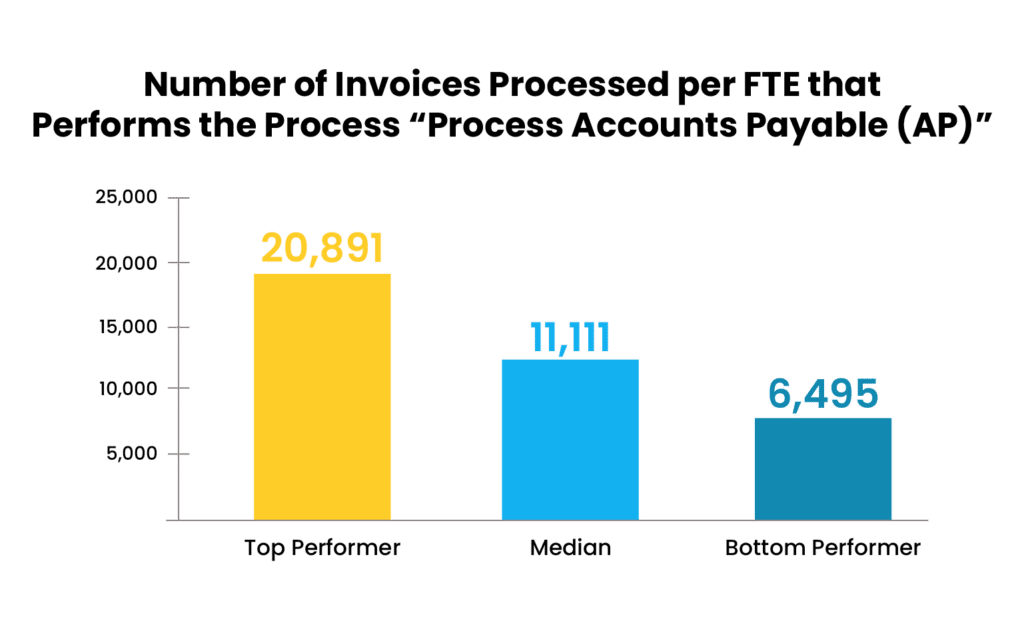
Measuring the output of each employee is a good gauge of an AP team’s overall efficiency and performance. High levels indicate more productive staff, most often assisted by process improvements like standardized and automated processes.
While there are many ways to determine staff productivity, the simplest is to divide your annual invoice volume by the number of FTEs (full-time equivalents) in your accounts payable department.
Calculate your staff productivity: Divide your annual invoice volume by the number of FTEs in your AP department.

For this accounts payable KPI, higher numbers are obviously better. APQC data shows that top performers process over three times the invoices of bottom performers.
3. Process efficiency
This metric is key to grasping how well AP procedures and systems support operations. Results can play a critical role in right-sizing workforces and evaluating options for role restructuring and automation.
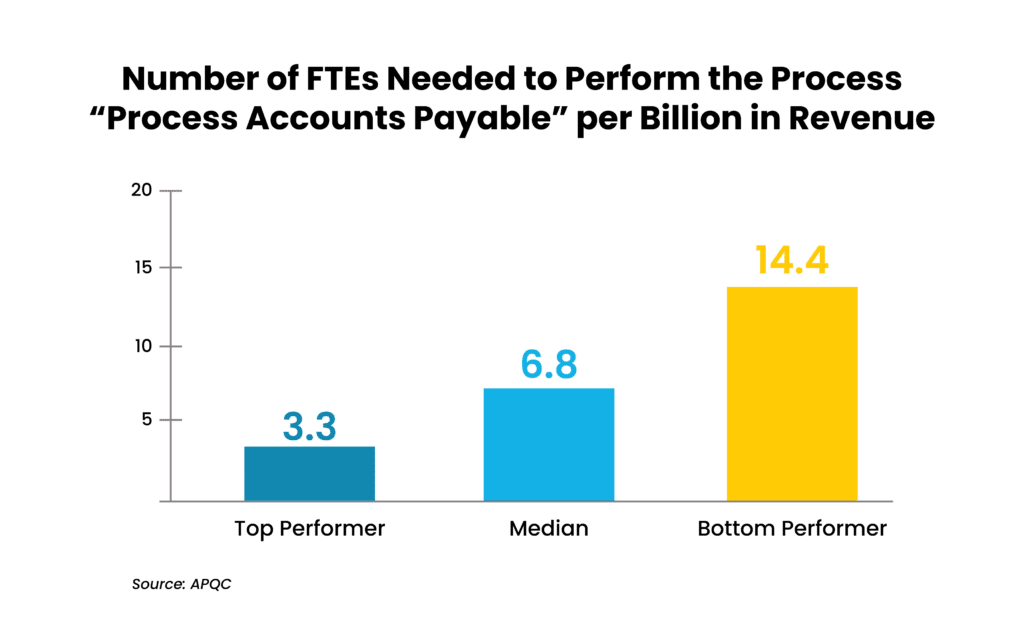
Calculate your process efficiency: An effective method is dividing the number of AP FTEs by the number of billions in revenue. APQC recommends tracking the number of AP FTEs per $1 billion in revenue.
For example, a company with $5 billion in revenue and 10 AP FTEs would have a process efficiency of 2 FTEs per $1 billion in revenue.

The latest APQC benchmarking data shows that bottom performers need more than four times as many resources to perform the AP process – requiring 14.4 FTEs per $1 billion in revenue compared to 3.3 FTEs for top performers.
With the right processes and tools to support a more efficient workflow, AP teams can improve this KPI by a substantial amount.
4. Cycle time
Cycle time metrics reveal whether your AP processes are accelerated or dragging. High cycle times generally indicate processes that need optimizing or bottlenecks in your workflow.
Measuring cycle time can also reveal which tasks take the longest and where team members spend most of their time. By measuring the time in calendar days it takes to receive, enter, approve and schedule a vendor invoice for payment, AP leaders can also determine how well AP teams collaborate with other departments.
Since accounts payable organizations depend on inputs across an enterprise to do their work effectively, approval processes are often a leading source of delays.
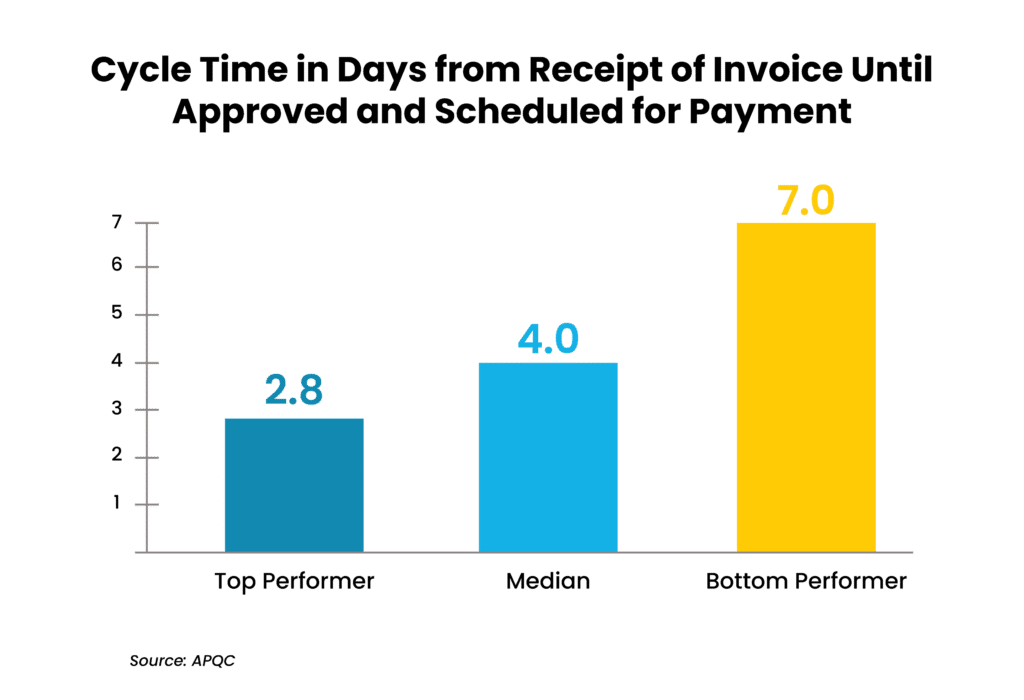
Calculate your cycle time: This cycle time metric measures the time in calendar days between receiving an invoice and approving and scheduling the corresponding payment.

The difference in invoice processing speed between top and bottom performers is substantial: top performers complete payments in 2.8 days or less, while bottom performers take a week or longer, according to APQC benchmarks.
Lowering this KPI number with process improvements like automated approval workflows helps organizations eliminate late payment penalties, maintain strong vendor relationships, and take advantage of early payment discounts.
More accounts payable benchmarks to consider
Once the four core KPIs are in place, finance leaders can add other accounts payable key performance metrics that zero in on specific improvement concerns. A balanced set of benchmarks holds the key to gaining a full understanding of AP operations and optimizing performance.
Consider these important options as you measure accounts payable performance:
- Days payable outstanding (DPO). The average number of days it takes for the business to pay back its accounts payable. Top performers find the sweet spot between satisfying vendors and making sure the business has enough cash.
- Vendor payment errors. It is important to spot trends and mitigate costly issues when it comes to paying vendors. Payment errors may include incorrect amounts, duplicate payments, or wrong addresses.
- Average invoice approval time. Getting other departments to approve invoices quickly ranks among the biggest challenges AP teams face, increasing average invoice processing time.
- Percentage of supplier discounts captured. Depending on your company’s cash position, taking advantage of supplier discounts can reap significant rewards like savings and business credit.
- Top payment methods. Checks remain common for B2B payments in North America, although 75% of AP departments plan to drastically increase their use of real-time payments within five years.
- AP expense as a percentage of revenue. Monitoring AP expenses as a percentage of revenue can help guide decisions about staffing counts and eliminating manual processes.
- Percentage of invoices processed straight-through. Measuring the number of invoices processed that are instantly matched with purchase orders and paid without intervention can help optimize the AP process.
- Number of invoice line items processed per FTE. Top-performers process over six times the number of invoice line items per FTE compared to bottom performers, reflecting the growing use of automation.
Many of these AP metrics also consider the “upstream” and “downstream” issues that affect AP performance and productivity. AP is just one part of the entire Purchase-to-Pay (P2P) process, and some of these additional metrics can help you pinpoint key issues occurring in other departments.
For example, while AP generally bears the brunt of process exceptions, very often price discrepancies between invoices and purchase orders are the result of issues within procurement, forcing AP to chase down the truth.
Similarly, if receiving of goods is not accurately reflected, AP must determine where the variance occurred (in the warehouse receipt or at the vendor shipment level). Errors and delays happening outside of AP may result in some of these metrics being skewed.
Here’s something else to keep in mind: Benchmarking is most effective when comparing organizations with similar characteristics. To ensure an “apples-to-apples” comparison, factors such as size, industry, location, and other relevant aspects should be considered.
For example, APQC notes that industries like distribution with high volumes of invoices tend to be early adopters of automation and process improvements that improve efficiency and lower costs – spending a median of $5 to process an invoice. Industries like government and military with lower invoice volumes tend to have less mature practices and automation initiatives – spending a median of $7.24 to process an invoice.
Benchmarking within your own industry helps you gain the most complete picture of your organization’s performance.
AP automation: Widening the gap between top and bottom performers
The gap between top and bottom performers is widening across many areas – and APQC points to the presence of mature AP automation capabilities in top-performing departments as the determining factor. Powered by advancing innovation like AI, machine learning, and Intelligent Document Processing (IDP), AP automation can deliver real-time visibility into cash flow, touchless payments, faster processing, a streamlined approval process, a better ability to catch fraud, fewer errors, standardized workflows, and decreased time and expense.
Case in point: APQC data shows that the median productivity level for AP FTEs who manually key in less than 25% of their invoice line items is almost twice that of FTEs who manually key in 75%. Organizations with higher degrees of automation also report 24% lower staffing levels than those without – improving costs and efficiency.
Not surprisingly, AP automation ranks as CFO’s top digitization priority for the third year in a row on the 2023 State of AP report. By automating time-draining tasks, 85% of AP teams experience efficiency gains and 64% achieve faster, more timely payments, the report found.
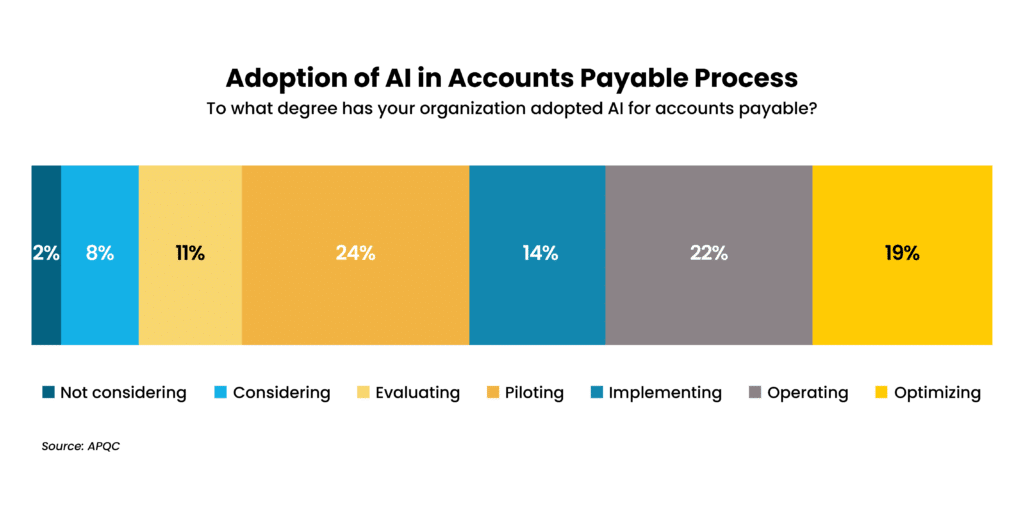
A quarter of AP organizations are also piloting AI-powered technology to enhance efficiency, accuracy, and cost savings – and more than half are actively using or optimizing AI tools within their organization, states APQC’s 2024 Accounts Payable Practices Report. The number of organizations piloting AI changes to 36% for companies with less than $1 billion in revenue – although only 36% are actively using the technology and 3% have reached the optimization stage, APQC reports.
Eliminating tedious manual tasks helps elevate accounts payable into a strategic asset to your business, gaining the bandwidth for value-add activities such as analyzing data, identifying trends, and providing actionable insights.
But while the potential benefits of AP automation are immense, APQC emphasizes that it is not a magic bullet that instantly leads to peak performance. After all, automating a process without fixing its underlying flaws only makes a poor process run faster.
Top performers maximize automation results by combining innovation with process optimization that standardizes and streamlines process steps and ensures automation is utilizing clean, reliable data. They further implement advanced analytics that use data to drive continuous performance improvement and informed decision-making.
Tracking the effectiveness of automation initiatives is key to ensuring the return on investment is positive. This could include tracking improvements to AP metrics such as invoice processing time, error rates, early payment discounts captured, on-time payment percentages, and average cost per invoice.
Why Auxis: empowering peak performance through finance transformation
AP benchmarking is a powerful tool for understanding how well your organization is performing and where improvement is needed. Compared to their peers, best-in-class organizations cost less, have greater accuracy, process payments faster, provide better visibility, and receive fewer supplier inquiries.
Nearly half of AP organizations rely on outsourcing or a combination of outsourcing and captive shared services to achieve peak performance, according to APQC’s Accounts Payable Practices report. Exceptional accounts payable outsourcing providers have the talent, best practices, and intelligent automation technology already in place to optimize your department while significantly lowering labor costs.
With more than 25 years of finance transformation experience, Auxis has a proven track record of achieving reduced costs and improved efficiencies in accounts payable departments – recognized as a Major Contender on Everest Group’s PEAK Matrix for Finance and Accounting Outsourcing Service Providers 2023 Report. Auxis’ finance outsourcing services are supported by robust intelligent automation capabilities – combining the business and technical expertise to identify the best improvement opportunities, prioritize a roadmap, and achieve sustainable AP success.
A high-performing accounts payable department understands success boils down to finding the balance between productivity and payment accuracy. Tracking the right accounts payable metrics and choosing the right AP outsourcing and automation partner hold the key to optimizing your AP operations – gaining the highest level of efficiency while delivering dependable outputs.
Want to learn more about optimizing the accounts payable process through nearshoring and automation? Schedule a consultation today! Or, visit our resource center for more AP tips, strategies, and success stories.


