Leveraging industry benchmarks to “rate” the services provided by the Finance function can be an important component in assessing the existing health and quality of your business operations.
Benchmarks can help you identify areas of opportunity to restructure your F&A organization, reduce staff, automate, and revise focus, all part of the post-pandemic “marching orders” for Finance executives. But are all benchmarks created equal? Do general industry benchmarks reflect the specific characteristics and dynamics of your business?
There are many resources out there that can provide benchmark data, including data that is segmented by various business demographics (industry sector, revenue size, geography, public vs. private, etc.). But to use benchmarking effectively, you need to find the proper alignment of business traits. For example, comparing a publicly-traded, Consumer Goods organization to a privately-held Professional Services firm is not going to present an effective comparison. Similarly, a $50B Retail organization and a $500M manufacturing organization have very different operating characteristics and resources.
And within those benchmarks, there are various levels that need to be understood to determine where you are today, and where you want to get to. Most benchmarking organizations like AQPC break down their data into some variation of Top Performer (75th percentile and above), Median Performer (50th percentile), and Bottom Performer (25th percentile and below). Where you are situated compared to those benchmarks is based strictly on quantifiable data, and doesn’t necessarily account for additional complexities within your operation.
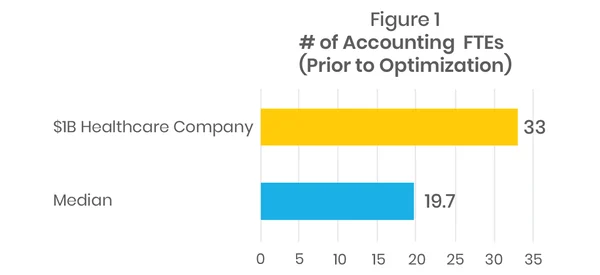
For example, consider a $1B healthcare organization with an Accounting department of 33 people, which was staffed 67% higher than the industry Median Performer benchmark of 19.7 FTE’s (see figure 1). They were categorized as a “Bottom Performer.”
But is this an “apples-to-apples” comparison? The company in question has more than 70 clinic-type locations that generated their revenue, compared to other healthcare organizations that were comprised of a few, large hospitals. The more geographically-diverse organization had additional operational and regulatory complexities, significantly higher transaction volumes and overlapping staff at the various locations, driving additional headcount.
Just comparing the data without understanding the underlying business characteristics would not be an effective form of analysis.
And once you understand and account for the business characteristics, what is the right performance level to aim for?
Most people would naturally want to target the Top Performer level as their goal, but is this realistic? When you look at the characteristics of a “Top Performer”, you will likely find an organization that has standardized their business processes and systems, limited the number of variations and exceptions in their transactions, simplified their business rules, and implemented automation solutions to reduce the amount of manual work being performed. They have made significant investments in their operation, and the ROI was considered sufficient to warrant that investment.
“Top Performer” sounds like a great place to live, doesn’t it? But can you afford the mortgage and upkeep?
Most F&A departments are happy to be “moving on up” from the tenements of “Bottom Performer” to the more upscale “Median Performer” neighborhood. Realistically, “Median” is where most organizations find themselves (hence the term), and if you are not there yet, it is a great (and attainable) goal.
“Most F&A departments are happy to be “moving on up” from the tenements of “Bottom Performer” to the more upscale “Median Performer” neighborhood.”

If you are at the Median Performer level, then it becomes a question of ROI; is it worth it to invest in the technologies, process changes and organizational restructuring needed to elevate your performance level? It can be costly and difficult to get there, so carefully consider your drivers and expected outcomes and payback before embarking on this path.
So how can you effectively use benchmark data to design and optimize your F&A organization?
Understand that benchmarks are data points, one part of a broader analysis that must be undertaken to clearly identify the reasons why an organization is structured as it is. However, sometimes those data points are like neon signs, illuminating the areas of opportunity, pointing to where a focused analysis can provide the details needed to solve the problem.
Consider our $1B Healthcare organization. We know that the company is geographically diverse, with high transaction volumes in terms of Account Reconciliations and Journal Entries. Compiling and analyzing their volumetric data, you see that each of the 70+ centers has between 40-50 GL accounts to be reconciled monthly.
That comes out to about 3,000 accounts reconciled monthly. Additionally, it was determined that because of the regional operation, the structure of the accounts, and the way they were treated, was inconsistent. And, all of these accounts were being managed manually, using Excel. It was a time consuming, grueling process, one that stretched the month end closing cycle to the middle of the month.
The Median Performer benchmark for managing GL accounts is 55.5 accounts per FTE. If you do the math, using that benchmark, the company would need 54 FTE’s to reconcile all of these accounts monthly. In case you don’t recall, that is 21 more people than they currently have in the Accounting department! So clearly, the situation is more complicated than the data shows.
What was really happening is that the Accountants were not reconciling every account, every month, and were spending considerable time cleaning up issues with unreconciled accounts, generating numerous journal entries to resolve the variances. There were many errors happening that required re-work and extensive oversight. The Accounting organization was spending all of its time reconciling, correcting, updating and closing, leaving no time for any type of analysis or business insights.
The benchmark pointed us in the right direction, and a further, rather quick analysis highlighted the root causes of the issues. The solutions were readily apparent (and not that complicated):
- Standardize the account structure and reconciliation process across all locations
- Reduce the number of accounts reconciled monthly, focusing on the most material accounts
- Implement an automated account reconciliation platform (there are many available on the market including BlackLine, Trintech, OneStream, etc.) to reduce the manual work being done to manage these accounts, focusing just on the variances
- Reduce the number of journal entries generated by the effort to clean up unreconciled accounts
- Restructure and streamline the Accounting organization, bringing a more structured and focused process with the ability to provide real-time quality control and oversight.
What was the impact of these improvement efforts?
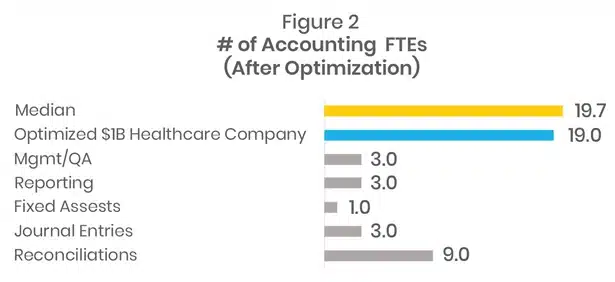
As you can see in Figure 2, the organization was able to considerably reduce the number of FTE’s from 33 to 19, right at the Median Performer benchmark level. This is equivalent to reaching the “Top Performer” benchmark level for GL Accounts/FTE (321) and Journal Entries/FTE (688). The company may not have been able to reach a “Top Performer” level in terms of FTEs because of their complexity, but a “Median Performer” level overall should be considered a big win.
Benchmark data by itself did not provide the answers to help this company optimize its Accounting operation, but it clearly showed where to look. Too often, organizations aren’t able to “see the forest for the trees”, as they are so busy running on that treadmill that they can’t take that step back to analyze what is really going on. Benchmarking can help you to “see the trees” and in particular, see which ones need to be chopped down.
Benchmarks can also help give you high level guidance towards a bigger solution…
Consider the case of a $600M multi-national Consumer Goods company, with operations in 7 different countries across North America and Latin America. The company’s F&A department totaled 110 FTE’s across the R2R, P2P, O2C and FP&A functions. Sounds high, right? Well, let’s see what the benchmarks tell us:
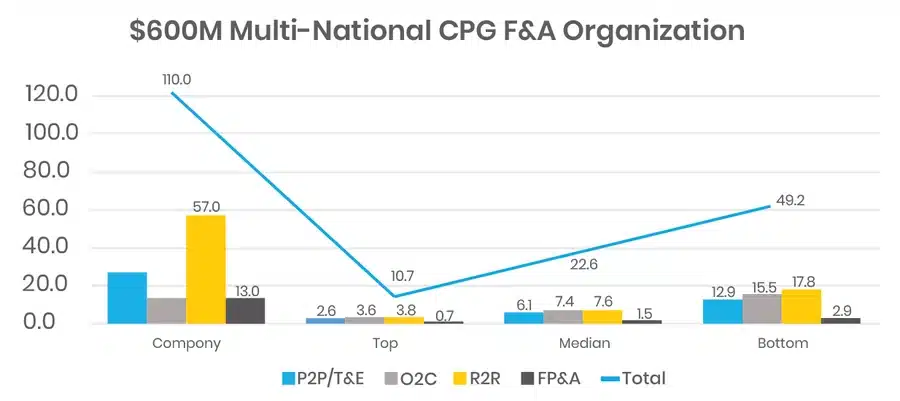
Based on benchmark data, the company was more than double the Bottom Performer level!
Now, the situation is made more complex because they operate in 7 different countries, and each country had its own F&A organization, creating overlapping roles across the different markets. Further, each country has its own set of tax, regulatory and accounting requirements, so additional complexities were in place.
But it doesn’t take much detailed analysis to determine that a significant opportunity to consolidate operations, increase productivity and reduce cost was available. And certain functions, such as R2R, which was operating at three times the bottom performer level, clearly represents an area of opportunity.
But what was the opportunity?
Typically, we can get anywhere from 10-20% synergies just from consolidating geographically diverse business operations (i.e. Shared Services). Additionally, bringing in various tools and technologies to improve productivity and operational efficiency can reduce another 30-40% of the staff needed to perform the tasks. But is there sufficient ROI to make these investments? Let’s do some quick math:
- 110 FTE’s currently
- You will need to retain some people in the local F&A organization, particularly in the R2R and FP&A functions, so let’s assume 1 person remains in each market for each function (a total of 14 retained FTE)
- The puts 96 FTE’s “in play”
- If we assume we can reduce 20% of these FTE’s (19) through consolidation, bringing us to 77 FTE’s
- If we assume another 40% can be reduced through process optimization and automation, that’s another 30 FTE’s reduced
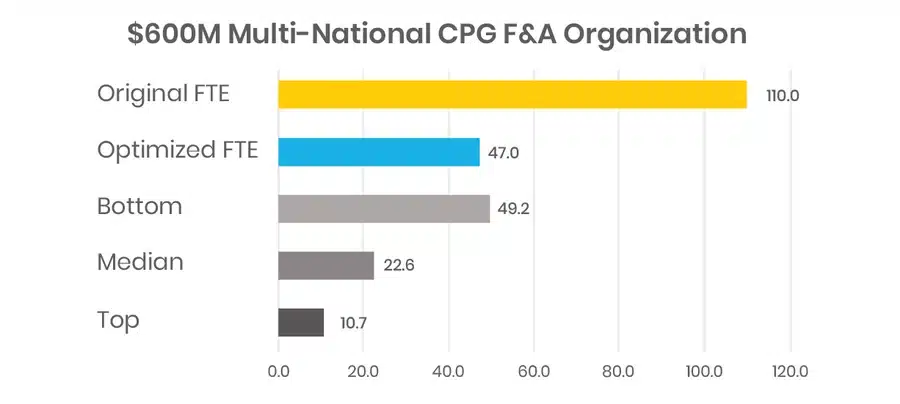
- The consolidated and optimized Accounting organization would now be 47 FTE’s, a total reduction of 49 FTE’s
- While this only brings the company to a “Bottom Performer” level based on size, it makes sense given the complexity of the multi-national operation
And with the reduction of approximately 50 FTE’s, the company could achieve a reduced annual operating cost of about $2,500,000, some of which can be used to fund the optimization initiatives needed to deliver the productivity and efficiency gains driving the reduced headcount.
While this approach is very high level, what it does is provide guidance on the potential opportunity, and the realization that it is realistic, given that the outcome puts them at a level that is certainly attainable from a benchmarking perspective.
Benchmark data can provide you with good insights into the current state of your F&A operation, and serve as a roadmap to future efficiencies. They should not be used as standalone metrics to drive an efficiency program, but given the need of F&A organizations to now be leaner, portable and flexible, they can be an important part of a broader analysis to help shape that program, and measure its outcomes.