According to benchmarking industry leader The Hackett Group, top benchmarking performers deliver services at 46% lower cost with 52% less FTEs than their lower performing peers. We know that benchmark data can provide insights into your organizational effectiveness, but what kind of conclusions can you really draw from analyzing this information?
Given the post-COVID focus on lean and portable operations, it makes sense to explore which finance benchmarks will give you the strongest insights into the health of your operation, and help you target opportunities to reduce and/or refocus your staff.
In my previous blog, I provided “real-world” examples of how benchmarking data can identify areas of opportunity within your F&A organization, helping to lay out a strategy to increase productivity and automation. In this blog, I will provide more insights into which benchmarks are good indicators of opportunity, and how to “read between the lines” to understand what may be impacting the current performance.
Benchmarking your organization should focus on a number of different performance-based elements which can be summarized under the headings of “Efficiency” and “Effectiveness”.
Efficiency Metrics
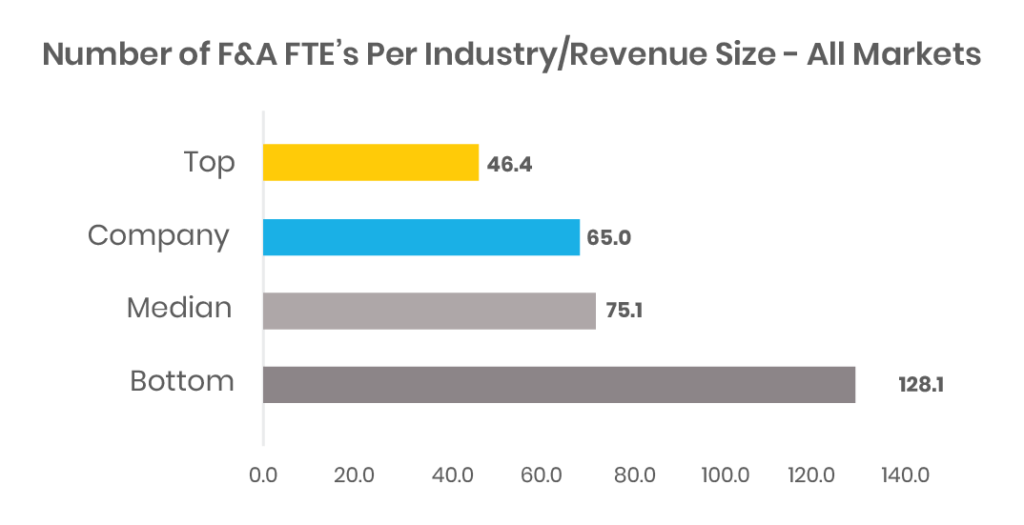
Traditional “Efficiency” metrics focus on the number of FTE’s (“full time equivalents”) performing various tasks, comparing organizations based on their industry and revenue size. Why should industry and revenue size matter? It’s all about volumes and complexity.
It is assumed that higher revenue companies will have a larger number of transactions, necessitating more people to manage them. Additionally, certain industries typically have more complex transaction types, again necessitating more people to perform these tasks. For example, a manufacturing and distribution company selling to “big box” customers will have more operational complexity than a professional services firm selling to the same customers. “Apples to apples” comparisons are important when it comes to benchmarking.
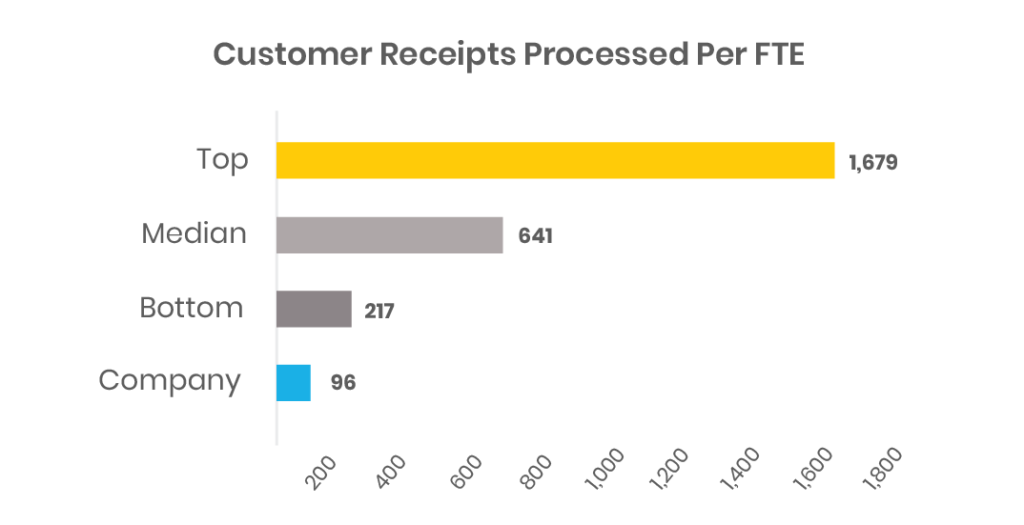
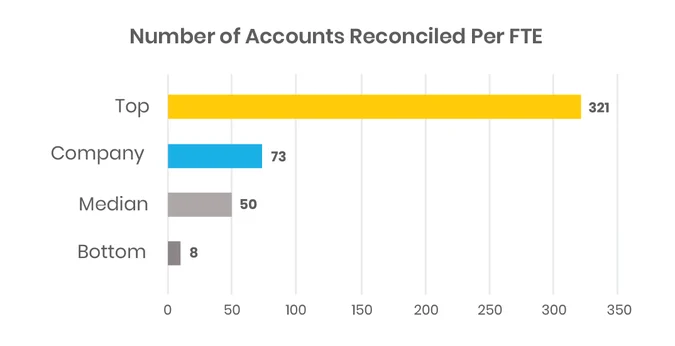
Other Efficiency metrics focus on productivity and performance. For example, in Accounts Payable, the number of invoices processed per FTE is a traditional “Efficiency” metric. Similarly, for General Accounting, the number of Balance Sheet Accounts being managed by an FTE, helps to measure the efficiency of the General Accounting organization. And for Accounts Receivable, the number of receipts processed by an FTE is a good “Efficiency” measure for this function. There are many other examples of Efficiency metrics that can be applied to your organization.
Effectiveness Metrics
Traditional “Effectiveness” metrics focus on the operating cost for the various functions, such as the Personnel Cost to perform the activities within a function, and the Total Cost to perform these activities. Personnel Cost is based on the fully loaded cost of the people within the team, doing the work, so there is a direct correlation to the Efficiency metrics listed above. Total cost includes both the Personnel Cost as well as the cost of the systems infrastructure needed to run the function.
Other Effectiveness metrics focus on the quality of the performance of activities. Examples of quality-based “Effectiveness” metrics include the accuracy of invoice processing and payments for Accounts Payable; Days Sales Outstanding (“DSO”) for Accounts Receivable; and the number of days to close the books and produce financial reports for Accounting.
The performance differences between organizations can be dramatic. For example:
- There is an 11% difference in AP invoice processing and payment accuracy between Top Performers and Bottom Performers, according to APQC, one of the world leaders benchmarking, best practices and performance improvement firms.
- APQC reports a 62% variance in DSO between Top and Bottom performers.
- There is a 100% delta between Top and Bottom performers when it comes to the number of days needed to close the books!
It is important to understand that benchmarks are data points, used to provide some insights into operational performance, but they do not provide “all the answers.” Some organizations have additional complexities that drive cost or impact operational performance that are not necessarily accounted for in the raw benchmark data.
It is important to understand that benchmarks are data points, used to provide some insights into operational performance, but they do not provide “all the answers.”
“Top” Performer is not always the target
Where you are and where you want to end up should consider the cost and effort required to get you there. As discussed in the previous blog, “Top Performer” may not make sense for all organizations. Does that seem counter-intuitive?
The levels of investment in systems and process automation tools in order to get you to the “Top” may not deliver enough benefits to warrant that investment. Typically, we have seen process automation (e.g. RPA) deliver strong ROI’s, with a payback period of 12 months of less. Most organizations would make that investment to achieve that result. But if your organization is not large enough to provide a comparable ROI, consider whether cost and effort are worth it. You will certainly gain more scalability, but the short-term financial benefits may not be there.
The “rule of thumb” that can be applied to all organizations is that “Bottom Performer” is not where you want to reside, and “Median” is typically a more realistic goal if you are considering performance improvement initiatives.
And even here, you have to consider the context of the organization. In recently working with a $500M CPG organization, we determined that the company’s closing cycle was 50% longer than its BOTTOM-PERFORMING peers. However, the company was privately held with no outside debt or investors, and the CEO/Owner was not demanding shorter closing cycles, as he was very close to the numbers and knew pretty much what was coming even before financial reports were issued.
This is a very different situation than if the company was publicly traded or has outside investors to report to. However, in speaking with the Accounting team, it was determined that they were spending so much time performing and managing closing activities that they had very little time to analyze and provide insights into the company’s financial performance.
Even though the organization didn’t require a shorter closing cycle for regulatory reasons, providing them with automation to facilitate the close (e.g., automated account reconciliation tool, journal entry workflow and document storage, financial closing management suite) would give them a significant operational benefit that could not be measured through traditional benchmarking data.
Benchmarking is not a “one size fits all” exercise
We recently worked with a $2B multi-national manufacturing company that had decentralized F&A operations, with 8 locations around the world. The company had F&A teams located at all of its manufacturing plants, focusing on localized financial operations, with specific (and unique) regulatory requirements for each country.
Some of the locations were in high-cost markets (North America, Europe, Australia), and others were in low-cost markets (Latin America, Africa, Asia). The company was in the process of standardizing its ERP platform across all markets, but certain markets still had older, disparate systems. The localized requirements and the systems variances made process standardization challenging.
We conducted a benchmark assessment of their various market operations to identify areas of opportunity for cost and productivity improvement, in order to consider establishing a centralized Shared Services operation.
The initial analysis showed us that the company was operating at 14% better than the Median performer level from a headcount perspective (Efficiency), but ran at a 26% higher personnel cost structure (Effectiveness) than a Median performing peer.
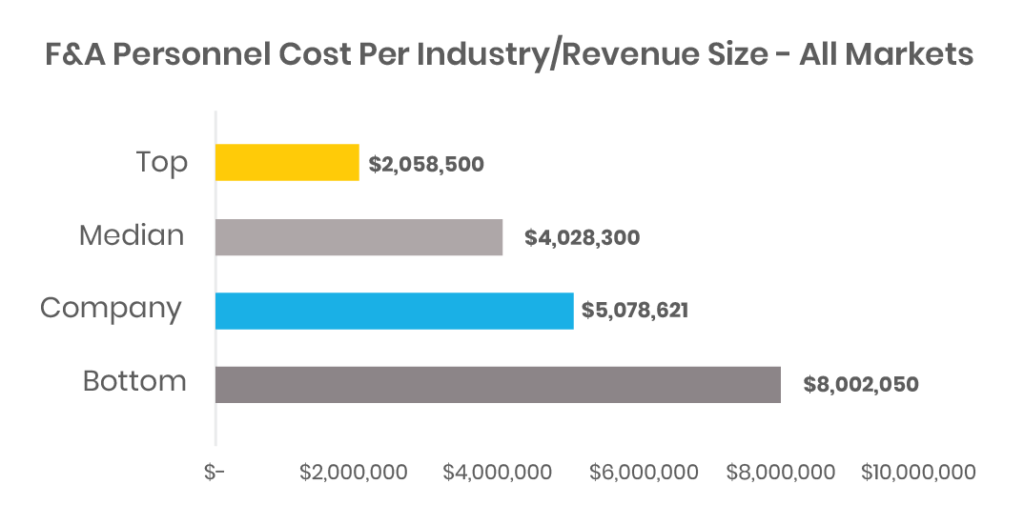
The company’s per FTE average cost for its F&A function was $78,000, compared to $54,000 for the Median performer. This higher cost was surprising given some of the low-cost markets in which the company operated. The overall opportunity to reduce its cost was significant, approximately $1,000,000 annually, based on the difference between their current level and the Median benchmark. Working the math, we would need to identify opportunities to reduce about 13 FTE’s to achieve the $1M annual cost savings, or 20% of the total staff.
How do we get there? Let’s look at some other numbers:
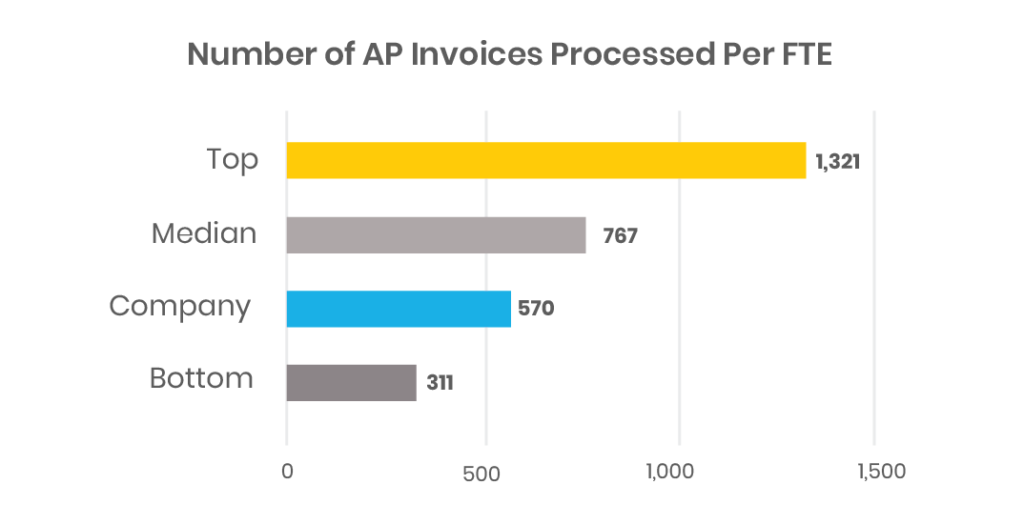
Reviewing the AP related benchmark data, the company was performing at approximately 25% below the Median performer. For the specific AR benchmark that we considered, the company was performing at 85% below the Bottom performer. This clearly indicates that there are opportunities for automation and performance improvement to drive efficiencies resulting in lower headcount.
For General Accounting, the company was performing at almost 50% above the Median performer, but there are still opportunities to drive additional performance improvements in this function as well. Typically you can gain at least 20-30% efficiencies (lower headcount) through centralization and automation initiatives. Based on the numbers, AP and AR should provide those opportunities and Accounting should offer some improvements as well.
But remember that the operations exist in multiple countries, requiring specific localized processes to support country regulatory requirements, and certain roles to remain in country (i.e., Finance Management, Tax, Treasury, etc.)
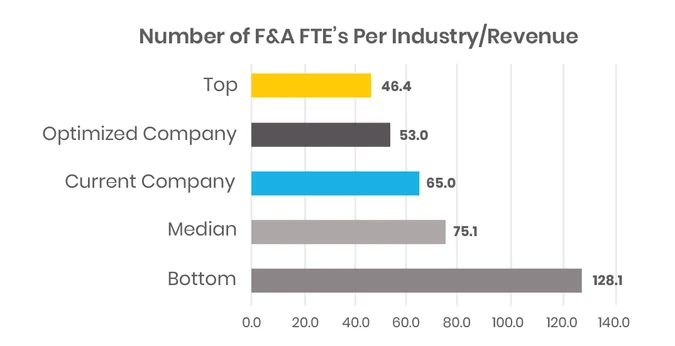
Further analysis of the client’s operations in all markets determined that we could potentially reduce 12 FTE’s across all markets through centralization and optimization (18%), and the resulting organization would consist of 53 FTE’s. Comparing the pre and post-optimized organizations to benchmark data, the company would now be operating at about 30% better than the Median performer, and approaching Top performer level.
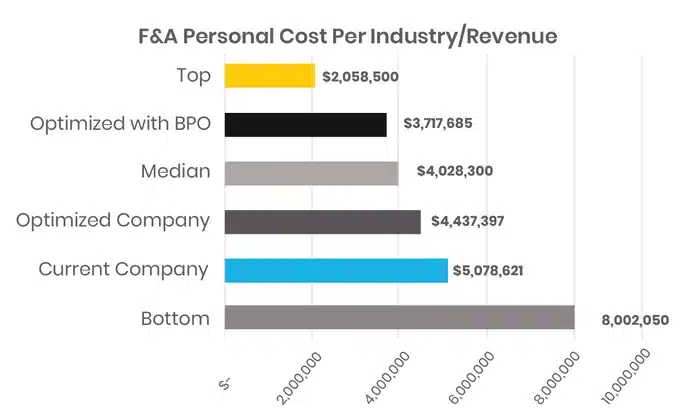
How does the optimized cost compare?
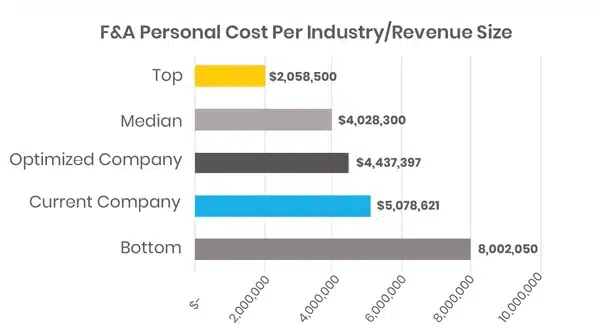
As you can see, there is a significant cost improvement (approx. $650,000 lower than current operating cost, using the client’s actual cost structure per function), and the company would now operate much closer to the Median performer level (within 10%).
Why is the cost still higher than the Median level, when the FTE count is 30% better than Median performer?
The answer lies in the nature of the client’s diverse business operation, which requires resources to be retained in country, with most of these retained positions being higher cost than the transactional roles being centralized. This is a good example of how benchmark data can provide insights, but not necessarily all of the answers, and why further analysis is required.
Outsourcing as a tool to further optimize your cost structure
To provide the client with further opportunities for cost savings, we analyzed the opportunity to utilize outsourcing for the transactional roles being centralized. Creating a hybrid model of retained resources in market, and outsourced transactional roles based in Costa Rica coupled with automation, the client would have the opportunity to achieve $1.4M in total cost savings (27%), and operate at 10% better than the Median benchmark level.
As you can see from this example, the use of benchmarking data analysis can provide real insights into the opportunities that are available for cost and productivity improvements within an organization.
Benchmarking analysis is not a standalone activity, but serves as a significant data point, pointing you in the right direction and indicating IF and WHERE potential opportunities are available. It can serve as the first step in a broader analysis, and given the post-COVID requirements for organizations to contain cost, improve productivity, get more scalable and shift operational focus, it’s a good exercise for organizations to undertake to provide the insights needed to take action.
To schedule a consultation to benchmark your finance organization, click here.